Quantcast
Channel: Taps Coogan, Author at The Sounding Line
Viewing all 2165 articles
Browse latest View live

Map of the Day: Household Income in Every County in the US

$
0
0

Submitted by Taps Coogan on the 3rd of September 2018 to The Sounding Line.

Continuing our series of regional level maps revealing demographic and economic trends around the world (here, here, here), the following interactive chart, from Visual Capitalist, shows the median household income for every county in the US based on data from 2012 to 2016.

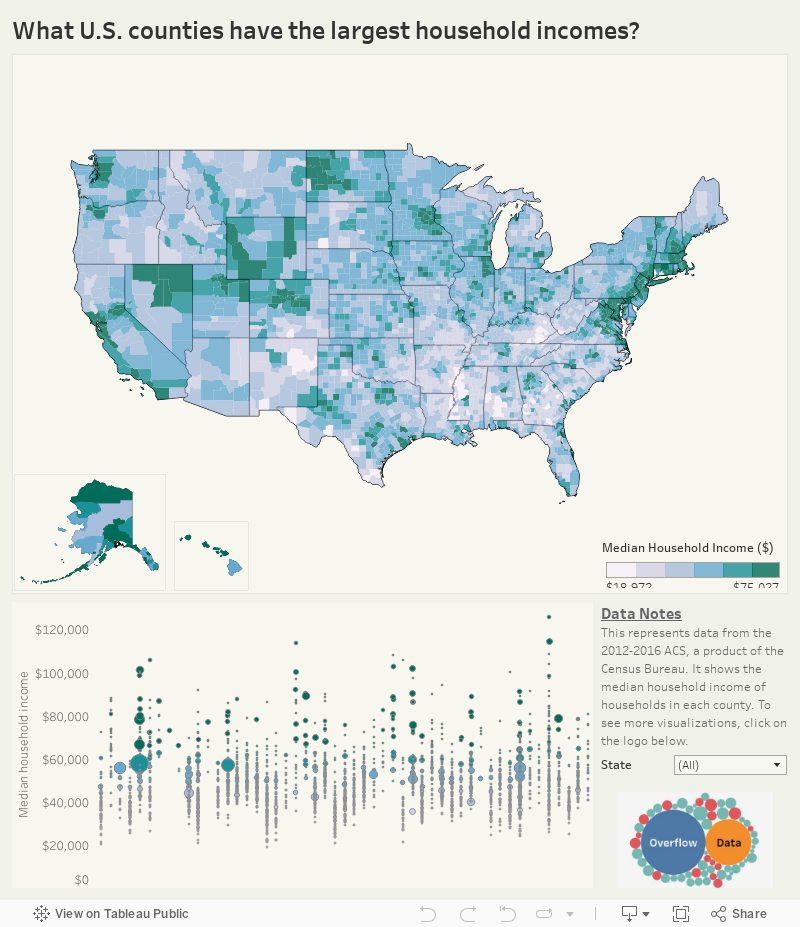
County-wide median household income varies by a stunning $106,700 across the US. The wealthiest county (Loudoun, Virginia) earns a median household income of $126,672 while the poorest (McCreary, Kentucky) earns just $18,972.

As can be seen in the map above, the highest earning counties tend to be clustered around major urban areas like Boston, New York City, Washington DC, Seattle, and San Fransisco, where the cost of living is also much higher. There are also wealthy counties throughout much of Wyoming, North Dakota, and northern Nevada. The poorest counties are scattered throughout the country with particularly high concentrations in Kentucky, West Virginia, and New Mexico.

As we have noted on several occasions, despite being in the midst of the longest bull-market in American history, wage growth continues to disappoint. Adjusted for inflation, hourly wages are now lower than this time last year and have been stagnant going all the way back to 1978, as the following chart from the Pew Research Center details.

Chart Courtesy of Pew Research Center

While the monetary-policy-led economic expansion of the past ten years has been good for those who own stocks, it has left behind the increasing percentage of Americans who don’t own significant financial assets. While there are reasons to believe that accelerating GDP growth and tightening labor markets may finally start to push wages higher, there is a long way to go before the wealth divide of the past decade is bridged.

If you would like to be updated via email when we post a new article, please click here. It’s free and we won’t send any promotional materials.

The post Map of the Day: Household Income in Every County in the US appeared first on The Sounding Line.


Map of the Day: The Greatest Extent of the Roman Empire

Nassim Taleb: There Is Not Enough Skin in the Game

$
0
0

Submitted by Taps Coogan on the 4th of September 2018 to The Sounding Line.

Nassim Taleb recently spoke at the Ron Paul Institute’s Media and War Conference to discuss his new book “Skin in the Game.” Mr. Taleb discusses a wide range of topics relating to his central belief that today’s leaders in media, government, and business do not have sufficient ‘skin in the game’ and are not impacted by instances of their own incompetence.

Enjoy:

P.S. If you would like to be updated via email when we post a new article, please click here. It’s free and we won’t send any promotional materials.

The post Nassim Taleb: There Is Not Enough Skin in the Game appeared first on The Sounding Line.

Image of the Day: Hay Trolley

$
0
0

Submitted by Taps Coogan on the 4th of September 2018 to The Sounding Line.

The following image, via Kingsly Harvest, is of a hay trolley.  Hay trolleys represent some of the first industrial products to emerge after the American Civil War which leveraged the enhanced foundry expertise gained by extensive weapon making. To learn more check out Hay Trolley Heaven.

Model: Hawkeye Generation 1 Timber Runner

P.S. If you would like to be updated via email when we post a new article, please click here. It’s free and we won’t send any promotional materials.

The post Image of the Day: Hay Trolley appeared first on The Sounding Line.

Map of the Day: Visualizing Our Rapidly Aging World

$
0
0

Submitted by Taps Coogan on the 5th of September 2018 to The Sounding Line.

Fertility rates are falling, fewer babies are being born, and average lifespans are increasing. The result is a stark and universal global aging, particularly pronounced among developed economies in Europe and the Americas. As the following maps from Aron Strandberg attests, the median age is getting older in every single county on Earth. The average age in the United States in 1960 was 29 years old. Today it is 38 years old and by 2060 it will be 42 years old. In Italy, the median in 1960 was 32, today it is 47, and by 2060 it will be 51. In Japan the median age was 25 in 1960, today it is 47, and by 2060 it will be 53.

Europe:

Africa:

Middle East:

Asia-Pacific:

Americas:

The good news is that life expectancy is trending higher in most countries around the world. That means healthier and longer lives for most people. The bad news is that aging populations mean an ever decreasing percentage of the global population is working age and an ever increasing percentage of people is retired. As we have discussed on numerous occasions here at The Sounding Line, declining ratios of workers to retirees and decades of expanding welfare and retirement benefits are putting pension systems and governments around the world under increasing strain.

The OECD reports that in Japan “the working age population is falling by about 1 percent per year, and the rate of shrinkage will eventually approach 1.7 percent per year, so that even productivity growth of 2% or more will deliver very low aggregate or per capita growth…There will simply be no way to sustain high living standards and quality public standards in a ‘super-aging’ Japan unless the country is able to achieve much higher rates of productivity growth.” In the US, entitlement programs have grown from less than 2% of GDP in the 1950s to nearly 14% today, a percentage which is expected to continue to grow more rapidly in coming years. Today there are fewer than three workers per retirement age citizen in nearly every developed economy. In Japan there are slightly less than two. In Italy and Greece there are barely more than 1.5 workers per senior, less than half the ratio in the 1960s.

Employed to Eldery Ration 1960 until 2016
Data Source: OECD & World Bank

Aside from an increase in birth rates, the only solution to the economic problems posed by an aging global populations is increased economic productivity. Unfortunately, productivity has remained stubbornly flat among developed economies, particularly in the European Union, where increasing tax and regulatory burdens have dis-incentivized capital investment and smothered new business and innovation.

P.S. If you would like to be updated via email when we post a new article, please click here. It’s free and we won’t send any promotional materials.

The post Map of the Day: Visualizing Our Rapidly Aging World appeared first on The Sounding Line.

Image of the Day: Anvil

$
0
0

Submitted by Taps Coogan on the 5th of September 2018 to The Sounding Line.

Via the great artist and cartoonist Jonathan Plotkin at Spontonist.com

P.S. If you would like to be updated via email when we post a new article, please click here. It’s free and we won’t send any promotional materials.

The post Image of the Day: Anvil appeared first on The Sounding Line.

George Friedman: Can China’s Expansion Be Checked?

$
0
0

Submitted by Taps Coogan on the 6th of September 2018 to The Sounding Line.

Amid increasing US-China tensions over trade and geopolitics, Geopolitical Futures‘ founder and Chairman George Friedman recently challenged the idea of China’s military expansion, particularly the growth of its Navy and its ambitions in the South China Sea.

Mr. Friedman notes:

“One area that they (China) have to control is the South China Sea. For ten years they have been building this navy that was going to sweep everybody away and they still don’t control the South China Sea… They have a navy. It now has one aircraft carrier. The United States has lots of aircraft carriers. So yes, they have increased the number of aircraft carrier infinitely from zero to one, but you can’t imagine the Chinese Navy challenging the American or the Japanese Navy. The newspapers who don’t understand a military balance will look at China and say ‘my God they’ve got a huge Naval program.’ So let’s ask a stupid question. What are they building? When will they build it and who will command it? The most important question about a navy is not the ship, it’s about the admiral.”

If you would like to be updated via email when we post a new article, please click here. It’s free and we won’t send any promotional materials.

The post George Friedman: Can China’s Expansion Be Checked? appeared first on The Sounding Line.

The Average Tenure of the US Supreme Court Every Year Since 1789

$
0
0

Submitted by Taps Coogan on the 7th of September 2018 to The Sounding Line.

Having presumably reached the final day of the chaotic Senate confirmation hearing of Supreme Court Judge nominee Brett Kavanaugh, it is as good a time as ever to reflect on changes to the average tenure of the Supreme Court. Much like we have done for members of the House of Representatives and the Senate, we have compiled a database of every Supreme Court Justice in the history of the United States. Using that data, the following chart shows the average tenure of the court every year since 1789 (the average number of years sitting judges have served on the Supreme Court in any given year). The data is current through the nomination of Justice Neil Gorsuch.

Average Tenure of the Supreme Court Every Year Since 1789

The all-time record tenure was set in 1861, when the sitting members of the Supreme Court had served an average of 19.6 years. When long serving anti-slavery Justice John McLean passed away that year, the average tenure fell and remained depressed for the next hundred years. 1861 also marked the start of the American Civil War and, incidentally, Justice McLean was succeeded by Justice Noah Haynes Swayne, the first Republican Supreme Court Justice in history. The average tenure of the Supreme Court has been marching higher since the 1940s and reached its highest level since 1861 before the nomination of Justice Gorsuch in 2017. The increasing average American lifespan likely has a great deal to do with that trend.

There is no particularly compelling reason to argue that a longer or shorter overall tenure is advantageous for the Supreme Court, but it is interesting to consider that the court is essentially the longest serving it has been since the outbreak of the Civil War.

If you would like to be updated via email when we post a new article, please click here. It’s free and we won’t send any spam.

The post The Average Tenure of the US Supreme Court Every Year Since 1789 appeared first on The Sounding Line.


Image of the Day: The Chapel

Map of the Day: Every European Country’s Maximum Extent

$
0
0

Submitted by Taps Coogan on the 8th of September 2018 to The Sounding Line.

As part of our ongoing series of historical video-maps, we present ‘Every European Country’s Maximum Extent,’ from YouTube creator Bulgarian Empire Mapping. As the name implies, the following video-map shows the borders of every European country at their greatest extent, whether it be France during Napoleon’s conquest of Europe in 1812, Germany during World War II, or Italy during the height of the Roman Empire. It is important to note that the borders of each civilization refer to their greatest extent in Europe and excludes colonies outside the continent.

To see other interesting historical maps check out:
The History of the Greeks
Every Year of the Roman Empire
Every Other Day of the Napoleonic Wars
Every Day of World War I
Every Day of World War II
Everyday of World War II in the Pacific
The History of the World Every Year
The Five Largest Cities Throughout History
Every Major Plague Epidemic in History
The Evolution of Modern Government
The Rise of Religions Throughout History
The History of Communism Since 1850
The History of Urbanization
The History of South America
How the World Got Obese
The History of North America
The History of Africa
The History of China Every Year
Every Nuclear Explosion in History
Every Year in The History of the Ottoman Empire
The History of the Middle East
The Loss of Native American Lands Within the US Every Year
Every Ruler in Europe Since 400 BC
Every Day of the Korean War
The Results of Every US Presidential Election in History
Every Week of the American War of Independence
The Rise and Fall of the Mongol Empire
The Population of Every Civilization in Europe Every Year Since 400 BC
The Rise and Fall of the French Empire
The Rise and Fall of the British Empire
The Rise and Fall of the Spanish Empire
The History of the Reconquista
The History of South Asia
The Great Turkish War
Every Other Day of the Russian Civil War
Every Year in the History of the British Isles

If you would like to be updated via email when we post a new article, please click here. It’s free and we won’t send any spam.

The post Map of the Day: Every European Country’s Maximum Extent appeared first on The Sounding Line.

Hong Kong’s Ultra Rich Population Overtakes New York’s, Surged by 31% Last Year

$
0
0

Submitted by Taps Coogan on the 9th of September 2018 to The Sounding Line.

As the following chart from Statista illustrates, Hong Kong has finally overtaken New York City as home to the World’s most ultra-rich. Ultra-High Net Worth Individuals (UHNWI) are defined as people with a net worth over $30 million and their numbers are growing rapidly. In the past year alone, the number of ultra rich grew by 13% to 255,810 individuals around the world.

While the US was once the world’s leading creator of millionaires and ultra-rich, that mantle has passed to China, and specifically Hong Kong, where the number of ultra-rich surged by 19% and 31% respectively last year compared to ‘just’ 9% in the US.

Infographic: Hong Kong's Ultra Rich Population Overtakes New York's | Statista You will find more infographics at Statista

As we have frequently discussed, years of monetary-policy-led economic expansion has fueled a decade of rapidly rising financial asset prices but tepid economic growth in most developed economies. That has greatly benefited the decreasing percentage of people that actually own financial assets and done very little for everyone else. While there are reasons to believe that accelerating GDP growth and tightening labor markets in the US may finally start to narrow the American wealth divide, growth rates outside the US are decelerating and one has to wonder how long US growth can remain robust amid an increasingly bearish global backdrop.

If you would like to be updated via email when we post a new article, please click here. It’s free and we won’t send any spam.

The post Hong Kong’s Ultra Rich Population Overtakes New York’s, Surged by 31% Last Year appeared first on The Sounding Line.

Sam Zell: After Ten Years of Weak Growth, Does It End or Do You Have a Catch-Up?

$
0
0

Submitted by Taps Coogan on the 10th of September 2018 to The Sounding Line.

Sam Zell, businessman, real-estate mogul, and Chairman of Equity Group Investments, recently spoke with Fox Business News about his views on the ongoing US trade negotiations with Canada and Mexico, as well as his outlook for the US economy.

Sam Zell:

“I think that the trade issues are issues that probably should have been brought up a long time ago. These agreements are old and… after 25 years of NAFTA, which had a lot of foreign policy elements to it, adjusting it makes sense. It’s hard for me to believe that any resolution here is not going to include both Mexico and Canada.”

Maria Bartiromo:

“Canada is sticking to its guns and basically saying we can’t lose this, we can’t lose that. There are certain things that it’s not going to move on.”

Sam Zell:

“But the one thing that they can’t lose is NAFTA… It feels like it’s going to get resolved. I happened to talk to one of the Mexican negotiators last week who was very enthusiastic about getting it done. So, I think the momentum is in the same direction.”

Sam Zell on the US economy:

“Everybody’s been predicting the next two year slowdown for about four years now… and for four years we haven’t had an end to ‘the longest string of positive scenarios,’ almost ten years of a positive environment… I think the question, and I asked a Nobel Prize winner this question about six months ago, (is): We have just come through eight years of subpar growth. The US system is built for give-or-take a 3% growth rate. Now that we have had 10 years of less than 2%, so do you have an end to it or do you have to have a catch-up before there is an end to it? I don’t know the answer and by the way the Nobel Laureate didn’t know the answer either.”

That question: how long can the US economy experience accelerating growth this late in an economic expansion amid deteriorating global economic conditions, is the question of the day. Time will tell.

There is more to the interview so enjoy it above.

If you would like to be updated via email when we post a new article, please click here. It’s free and we won’t send any spam.

The post Sam Zell: After Ten Years of Weak Growth, Does It End or Do You Have a Catch-Up? appeared first on The Sounding Line.

Charles Millard: Under-Funding Pensions Is Equivalent to a Tax Hike

$
0
0

Submitted by Taps Coogan on the 11th of September 2018 to The Sounding Line.

Former Pension Benefit Guaranty Corporation Director and Kiski Group Managing Director Charles Millard recently spoke with CNBC’s Rick Santelli about the ongoing pension under-funding crisis, which has now reached nearly $4 trillion in the US, equivalent in size to Germany’s entire annual GDP. Mr. Millard emphasizes how continued under-funding of public pensions is, in effect, an obligation to raise taxes in the future.

Santelli Exchange: Underfunded pension liabilities from CNBC.

Charles Millard:

“The fact of the matter is that people in states and throughout the country have not made their contributions for years and years and years. So when you make a promise and you don’t fund it, you don’t put the assets in there, the liabilities continue to grow. But if you haven’t put the assets in, the assets aren’t growing. And around 2010, people were putting in around 80% of what they were supposed to put in. Now, they are putting in about 90%. That sounds a lot better but that’s still a 10% hole across the board for whether or not states or cities are actually making the contributions they are supposed to make.”

Rick Santelli:

“As a market person, what really hits me, Charles, is that they’ve given up quite a bit of return in the equity markets in the last 20 months, and even though they’ve upped the percentage, we have no idea what may be ahead of us with regards to markets and investments and returns… How can states and local managers of this capital try to protect themselves and diversify, yet accumulate faster?”

Charles Millard:

“I think the really important point to make in terms of investments, Rick, is that most pensions have returned reasonably well. If you took the average return of a public pension over the last 30 years, it’s around 9%. So the issue in pension under-funding is… you got to put (money) in in the first place. If you don’t put it in you are not going to fill the hole… Moody’s makes the point that if you are not funding your pension, it’s going to be the equivalent of a tax hike in the future cause you are still going to have to pay for police, and teachers, and firefighters, etc…”

There is more to the interview above.

If you would like to be updated via email when we post a new article, please click here. It’s free and we won’t send any spam.

The post Charles Millard: Under-Funding Pensions Is Equivalent to a Tax Hike appeared first on The Sounding Line.

Image of the Day: Eiffel Tower Under Construction

Ray Dalio: We Are in the 7th Inning of This Expansion

$
0
0

Submitted by Taps Coogan on the 12th of September 2018 to The Sounding Line.

Ray Dalio, founder of Bridgewater Associates, recently gave a rare and wide ranging interview to CNBC to discuss his new book ‘A Template for Understanding Big Debt Crises’ (it can be downloaded for free here), and to share his outlook for the economy. Mr. Dalio argues that the best historical analogue for the current economic environment is the 1930s.

Watch CNBC’s full interview with Ray Dalio on lessons from the financial crisis from CNBC.

Mr. Dalio:

“Generally speaking, we are in… the seventh inning of this cycle. I think we are at the stage in the cycle where interest rates are being raised. We’re in the later stage. Maybe we have… two more years… into the cycle and then the issues of this debt crisis are very different than the issues of the last debt crisis. Each one is a little bit unique. This one looks very much more like the 1935 to… 1940 period. 1929 to ’32 and 2008 to 2009 we had a debt crisis and interest rates hit zero. In both of those cases interest rates hit zero, the only two times in the century. There is only one thing to do next and that is to print money and buy financial assets. So in both of those cases that’s what the central bank did and they pushed asset prices up. As a result we had an expansion, we had markets rising, and we particularly had an increase in the wealth gap because if you’d owned financial assets, you got richer and if you didn’t you didn’t. And so today we’ve got a wealth gap that’s the largest since that period (the 1930s)… As a result, we have populism. Populism is the disenchanted, capitalism not working for the majority of people… So we have a political gap, a social gap in terms of the economics, and we are coming into the phase where we are beginning the tightening cycle. 1937 we (began) a tightening cycle. No tightening cycle ever works out perfectly. That’s why we have recessions. You can’t get it perfectly. So as we are going into this particular cycle, we have to think, what will this downturn be like…?”

On the prospect of less effective monetary policy in the future:

“We have less effective monetary policy because so far there are two types of monetary used: Lowering interest rates, we can’t lower interest rates. The second is quantitative easing and it’s maximized its effect. So I think that the next downturn is going to be a different type of downturn. I think that pension problems, healthcare problems in terms of obligations that are not funded, that are not debt, I think it will be more difficult in terms of the social political problems and I think it will be more difficult to handle. It won’t be… the same in terms of the big bang debt crisis. It will be a slower growing, more constricting sort of debt crisis that I think that will have bigger social implications and bigger international implications.”

There is much more to the interview, so enjoy it above.

To see Mr. Dalio explain the economic cycle, read this.

If you would like to be updated via email when we post a new article, please click here. It’s free and we won’t send any spam.

The post Ray Dalio: We Are in the 7th Inning of This Expansion appeared first on The Sounding Line.


Taps Coogan: If There Is Such a Thing as Economic ‘Good Times,’ These Are They

$
0
0

Submitted by Taps Coogan on the 13th of September 2018 to The Sounding Line.

The US in the midst of the longest bull market in American history. GDP growth is above its long term average. Small business sentiment is the best on record. After the longest period of continuous jobs growth in nearly a century, unemployment is at its lowest level in two generations. Food stamp enrollment is at its lowest level in eight years. The Federal Reserve is normalizing monetary policy by raising interest rates and reducing its balance sheet. The Dow Jones Industrial Average is up over 5% year-to-date and the S&P 500 is up over 9%. Both indices have posted positive yearly returns for eight out of the past nine years, with the exception being a minor decline in 2015. Corporate earnings have reached an all-time record high. Banks still have trillions of dollars of excess reserves. The US dollar has strengthened and its usage in allocated global currency reserves has risen to its highest level in 20 years.

Not for everyone and not equitably, but if there is such a thing as economic ‘good times,’ these are they. All of this, despite tightening financial liquidity, slowing growth and a bear market in China, brewing trade tensions, negligible growth in Europe and Japan, swelling federal government deficits, a brewing currency crisis in several emerging markets, and the perception of domestic political turmoil. One can see the storm clouds gathering on the horizon.

We all know that good times don’t last forever. The question is: how long can they last for? In the search for a useful analogue, parallels are being drawn between virtually every period in American history. Some have argued that this era is most reminiscent of the 1920s. Ray Dalio makes a compelling case for the late 1930s. Peter Schiff has long argued that the 1970s are a useful analogue. Art Cashin has compared today’s volatility to to that of 1987. Others have argued that today is more like the late 1990s Asian Currency Crisis. Or is it 2000? Chris Martenson prefers 2008.

The truth is that useful parallels can be drawn with virtually every economic cycle because they all share similar attributes: excess liquidity leading to asset bubbles followed by constricting liquidity which reaches some always-hard-to-forecast critical level, popping the bubble. The US is now somewhere in that constricting phase. While various analysts point to different economic cycles in American history, they all point to the same period in those cycles: the part within a year or two of the bubble popping. While they may all be wrong (it happens), history is on their side. Tightening cycles virtually always end in recession, usually within a handful of years. So while times are looking good, and there will inevitably be a certain momentum to that fact, there is no better time to contemplate what has always come next: not good times.

If you would like to be updated via email when we post a new article, please click here. It’s free and we won’t send any spam.

The post Taps Coogan: If There Is Such a Thing as Economic ‘Good Times,’ These Are They appeared first on The Sounding Line.

James Grant: This Year the US Treasury Will Issue the Most Debt Relative to GDP Since World War Two

$
0
0

Submitted by Taps Coogan on the 14th of September 2018 to The Sounding Line.

James Grant, of Grant’s Interest Rate Observer, recently spoke at length to Sprott Media about the US national debt, interest rates, and precious metals. In particular, Mr. Grant warns about the mounting volume of federal debt being issued by the US Treasury.

James Grant:

“This year… the government will issue… the most government securities as a percentage of GDP since the end of World War II. So the supply of government securities in relation to national production is the highest since the mid 1940s. Although this country is under arms in some degree, but it’s not waging a world war, so this is a very different fiscal picture than what we have been used to.”

There is much more to the interview, so enjoy it above.

If you would like to be updated via email when we post a new article, please click here. It’s free and we won’t send any spam.

The post James Grant: This Year the US Treasury Will Issue the Most Debt Relative to GDP Since World War Two appeared first on The Sounding Line.

Image of the Day: Faces

$
0
0

Submitted by Taps Coogan on the 15th of September 2018 to The Sounding Line.

Via the great artist and cartoonist Jonathan Plotkin at Spontonist.com

If you would like to be updated via email when we post a new article, please click here. It’s free and we won’t send any spam.

The post Image of the Day: Faces appeared first on The Sounding Line.

The Fastest Growing Countries in the World

$
0
0

Submitted by Taps Coogan on the 15th of September 2018 to The Sounding Line.

As we have noted on the a number of occasions, Africa’s population is in the midst of a rapid expansion. For the first time in recorded history, the population of Africa is expected to rise from between 10 to 15% of the global population to nearly 40% by the year 2100.

Chart Courtesy of Metrocosm

Accordingly, as the following graph from Aron Strandberg attests, 19 of the 20 fast growing countries in the world can now be found in Africa. Niger, currently the fastest growing country on Earth, is expected to see its population increase by 366% by 2060. Following Niger comes Zambia, Angola, and Uganda. The only non-African country in the top 20 is Iraq, whose population is expected to grow by 166% by 2060.

The trouble with Africa’s rapid population growth is that it is already a major food importer (PDF) and the challenge of supporting several fold increases in population within just a few decades will be monumental. As we first discussed here, the total area of land being used for agriculture around the world peaked around 2000 and Africa’s agricultural yields remain far lower than the rest of the world’s and have seen little improvement in past decades.

Data Source: FOA.org
Chart Courtesy of World Resources Institute

Even if Africa’s agricultural yields are brought up to the same level as the developed world, that alone won’t be enough to meet the ends of Africa’s surging population according to most estimates. That means Africa is likely to become increasingly dependant on food imports for the foreseeable future.

If you would like to be updated via email when we post a new article, please click here. It’s free and we won’t send any spam.

The post The Fastest Growing Countries in the World appeared first on The Sounding Line.

Map of the Day: The French Invasion of Mexico

$
0
0

Submitted by Taps Coogan on the 16th of September 2018 to The Sounding Line.

As part of our ongoing series of historical video maps, we present ‘The French Invasion of Mexico,’ by YouTube Creator EmperorTigerstar. In 1861, after the costly and destructive Reform War, Mexico’s government found itself greatly over-indebted and unable to secure additional financing. It subsequently defaulted on large debts to France, Spain, and Britain. With the US tied up in the American Civil War and thus unable to enforce the Monroe Doctrine, France, Spain, and Britain invaded Mexico to pressure the government into repaying its debts, or else recover the money themselves. It soon became clear that France, under the rule of Napoleon III, intended to unilaterally overthrow the Mexican government and establish a French controlled puppet government, which the French did. Spain and Britain abandoned the French effort, leaving the French and their newly created ‘Second Mexican Empire‘ to fight against local opposition. The French designated Maximilian I, younger brother of Austrian emperor Francis Joseph I, as the Emperor of Mexico. However, the local republican forces which had previously won the Mexican Reform War and defaulted on Mexico’s debts, remained resistant. As the US emerged from the civil war, it began supplying and financing the Mexican republican forces and pressuring the French to end their support for the Imperial Mexican government. To avoid an escalating conflict with the US, France withdrew its troops from Mexico and the Imperial Government quickly fell. Maximilian was executed by the Republican Government.

To see other interesting historical maps check out:
The History of the Greeks
Every Year of the Roman Empire
Every Other Day of the Napoleonic Wars
Every Day of World War I
Every Day of World War II
Everyday of World War II in the Pacific
The History of the World Every Year
The Five Largest Cities Throughout History
Every Major Plague Epidemic in History
The Evolution of Modern Government
The Rise of Religions Throughout History
The History of Communism Since 1850
The History of Urbanization
The History of South America
How the World Got Obese
The History of North America
The History of Africa
The History of China Every Year
Every Nuclear Explosion in History
Every Year in The History of the Ottoman Empire
The History of the Middle East
The Loss of Native American Lands Within the US Every Year
Every Ruler in Europe Since 400 BC
Every Day of the Korean War
The Results of Every US Presidential Election in History
Every Week of the American War of Independence
The Rise and Fall of the Mongol Empire
The Population of Every Civilization in Europe Every Year Since 400 BC
The Rise and Fall of the French Empire
The Rise and Fall of the British Empire
The Rise and Fall of the Spanish Empire
The History of the Reconquista
The History of South Asia
The Great Turkish War
Every Other Day of the Russian Civil War
Every Year in the History of the British Isles
Every European Country’s Maximum Extent

If you would like to be updated via email when we post a new article, please click here. It’s free and we won’t send any spam.

The post Map of the Day: The French Invasion of Mexico appeared first on The Sounding Line.

Viewing all 2165 articles
Browse latest View live


Latest Images